|   |
| |
These option sets are consistent across all ReportBuilders, providing you with a familiar group of tools each time you create a ReportBuilder report.
The ReportBuilder Options page contains a list of data variables related to the ReportBuilder you are working with, representing data collected in various AWARDS locations, and grouped into sections by data type. Several of these variable sections - described in detail in the alphabetical list below - are common across ReportBuilders.
![]() TIP: For more information on those data variables that are not common and are instead specific to the ReportBuilder you are working with, please refer to the portion of Online Help corresponding to that individual ReportBuilder.
TIP: For more information on those data variables that are not common and are instead specific to the ReportBuilder you are working with, please refer to the portion of Online Help corresponding to that individual ReportBuilder.
When working with data variables in ReportBuilders, keep in mind that:
![]() Each data variable to be included in the ReportBuilder report must be checked off on the Options page during the report generation process (detailed here). This can be done individually, or using the available Check All option(s) as needed.
Each data variable to be included in the ReportBuilder report must be checked off on the Options page during the report generation process (detailed here). This can be done individually, or using the available Check All option(s) as needed.
![]() To expand/collapse individual data variable sections as you work, use the available -/+ icon to the left of each section's name. Click
To expand/collapse individual data variable sections as you work, use the available -/+ icon to the left of each section's name. Click ![]() to collapse the section. Click
to collapse the section. Click ![]() to expand the section. Use of this option can be particularly helpful when working with ReportBuilders that have many sections with a large number of variables.
to expand the section. Use of this option can be particularly helpful when working with ReportBuilders that have many sections with a large number of variables.
![]() Data variable selections with an asterisk (*) next to them are those for which there may be multiple values. Multiple value fields include those that have checkboxes for data entry where multiple boxes may be checked for each record, as well as instances where multiple records may have been entered.
Data variable selections with an asterisk (*) next to them are those for which there may be multiple values. Multiple value fields include those that have checkboxes for data entry where multiple boxes may be checked for each record, as well as instances where multiple records may have been entered.
![]() The data variables available for selection are those collected by the program for which the report is being run (when applicable). If a group of programs has been chosen, the available variables are those collected for any program in that group. In some cases this may result in blanks in the report contents if a variable has been chosen for inclusion that is not collected by certain programs in the group.
The data variables available for selection are those collected by the program for which the report is being run (when applicable). If a group of programs has been chosen, the available variables are those collected for any program in that group. In some cases this may result in blanks in the report contents if a variable has been chosen for inclusion that is not collected by certain programs in the group.
Date Parts
Common to all ReportBuilders that have date variables available for selection. These variables are intended to allow for greater flexibility of reporting around dates; for example, giving you the option to report out on a month as either a number (1) or a written month (January). Specifically, for each date variable the corresponding selections are also available under "Date Parts:"
|
Variable |
Data Format |
|
Month |
Number: 1 - 12 |
|
Month and Day |
Number: mm/dd |
|
Month and Year |
Number: mm/yyyy |
|
Year |
Number: yyyy |
|
Month Name |
Text: January - December |
|
Month Name and Day |
Text and Number: ex May 6 |
|
Month Name and Year |
Text and Number: ex May 2015 |
Demographics
Client-specific ReportBuilders typically contain a variety of demographics variables pulled from locations such as client face sheets and intake/admission records. They may also include several characteristics which are not necessarily found on those forms; for example, "Age," "Age at Intake," and "Client ID." Similarly, employee-specific ReportBuilders can be configured to pull a variety of employee demographics information from Staff Information records in the Human Resources module.
Note Writer Information and Signature Information
Several services-related ReportBuilders (specifically the Service Contacts, Progress Notes, Contacts Log, Supportive Services Checklist, and Group Notes ReportBuilders) make available a variety of Note Writer Information data variables. These variables can be used to pull information on individual note writers into the report from within their Staff Information records in the Human Resources module.
Similarly, within the FormBuilder ReportBuilder a section of Signature Information data variables is available for each Signature form field configured to record an electronic employee signature. These variables can likewise be used to pull information on individual form signers into the report from within their Staff Information records in the Human Resources module.
Which pieces of Staff Information records are available to you among the Note Writer Information or Signature Information variables in the relevant ReportBuilders is based on whether you have a Human Resources Data permission and, if so, which one. Specifically:
Staff with the "Human Resources Data Full Access" and "Human Resources Data Read Only" permissions can view a full complement of staff information for all staff.
Which pieces of Staff Information records are available to you among the Note Writer Information or Signature Information variables in the above mentioned ReportBuilders, is based on whether you have a Human Resources Data permission and, if so, which one. Specifically:
![]() Staff with the "Human Resources Data Full Access" and "Human Resources Data Read Only" permissions can view a full complement of staff information for all staff.
Staff with the "Human Resources Data Full Access" and "Human Resources Data Read Only" permissions can view a full complement of staff information for all staff.
![]() Staff with the "Human Resources Data Work Supervisees" permission can view a full complement of staff information only for people they supervise, for others the data is limited.
Staff with the "Human Resources Data Work Supervisees" permission can view a full complement of staff information only for people they supervise, for others the data is limited.
![]() Staff who do not have any of the Human Resources Data permissions can view only a limited set of staff information variables and the corresponding data for those variables.
Staff who do not have any of the Human Resources Data permissions can view only a limited set of staff information variables and the corresponding data for those variables.
![]() TIP: For more information about Human Resources Data permissions, click here.
TIP: For more information about Human Resources Data permissions, click here.
When working with the Note Writer and Signature Information data variables, please keep in mind the following:
![]() A full complement of staff information - when available based on the rules noted above - includes all data variables collected on staff information records in the Human Resources module. (If your agency's Staff Information records include a FormBuilder form and any of that form's fields are set to display on related ReportBuilders, those fields are also included among the full complement of Note Writer and Signature Information variables.) If you instead have the limited data set referenced above, you will only have access to the following variables and corresponding data:
A full complement of staff information - when available based on the rules noted above - includes all data variables collected on staff information records in the Human Resources module. (If your agency's Staff Information records include a FormBuilder form and any of that form's fields are set to display on related ReportBuilders, those fields are also included among the full complement of Note Writer and Signature Information variables.) If you instead have the limited data set referenced above, you will only have access to the following variables and corresponding data:
- First, Last Name
- Last, First Name
- First Name
- Last Name
- Eligible Provider (if applicable)
- Authorization Credentials
- Payroll Group
- Department
- Work Supervisor
- Job Title
- Worksites
![]() If you have the "Human Resources Data Work Supervisees" permission and choose to run a ReportBuilder report that includes note writers or signers who both are and are not your supervisees, any limited-access data variables included will show as blank on the report when the note writer or signer is not one of your supervisees.
If you have the "Human Resources Data Work Supervisees" permission and choose to run a ReportBuilder report that includes note writers or signers who both are and are not your supervisees, any limited-access data variables included will show as blank on the report when the note writer or signer is not one of your supervisees.
![]() If you choose to use a saved report format that includes Note Writer or Signature Information variables that you do not have the authority to view, you will receive an error message informing you of that fact. Additionally, if the saved report format is for an ExportBuilder, please be aware that the resulting report might not be accurate in such cases.
If you choose to use a saved report format that includes Note Writer or Signature Information variables that you do not have the authority to view, you will receive an error message informing you of that fact. Additionally, if the saved report format is for an ExportBuilder, please be aware that the resulting report might not be accurate in such cases.
Return to the top of the page.
ReportBuilder filter options are located at the top of the Report Options - Continued page. These filters enable users to adjust the scope of report contents by applying user-specified criteria to the report variables chosen on the initial Report Options page.
![]() TIP: Filters are applied to the report contents regardless of whether those contents are displayed using the individual detail report options, summary tables, or both. For more information on individual detail click here, and for summary tables click here.
TIP: Filters are applied to the report contents regardless of whether those contents are displayed using the individual detail report options, summary tables, or both. For more information on individual detail click here, and for summary tables click here.
![]() IMPORTANT! When using the "All Clients" option on the ReportBuilder Settings page AND using filter functionality, the report displays clients matching the applied report filters and displays all remaining clients who do not meet the filter criteria with "--" in the record fields.
IMPORTANT! When using the "All Clients" option on the ReportBuilder Settings page AND using filter functionality, the report displays clients matching the applied report filters and displays all remaining clients who do not meet the filter criteria with "--" in the record fields.
To use the ReportBuilder report filters, complete the following steps:
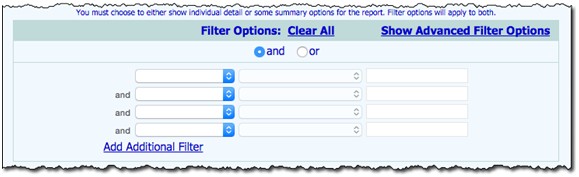
![]() Basic Filtering - The default option. Allows you to combine multiple filters using EITHER "and" OR "or" combinations, as shown below, but not both.
Basic Filtering - The default option. Allows you to combine multiple filters using EITHER "and" OR "or" combinations, as shown below, but not both.
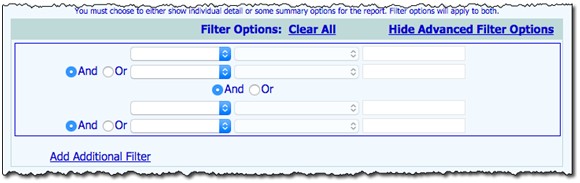
![]() Advanced Filtering - Allows you to have multiple sets of filters with BOTH "and" AND "or" combinations. To use advanced filtering, click the Show Advanced Filter Options link in the top right corner of the "Filter Options" portion of the page. The page is refreshed to display a filter "set" with a border around it as shown here.
Advanced Filtering - Allows you to have multiple sets of filters with BOTH "and" AND "or" combinations. To use advanced filtering, click the Show Advanced Filter Options link in the top right corner of the "Filter Options" portion of the page. The page is refreshed to display a filter "set" with a border around it as shown here.
![]() TIP: Keep in mind that you can switch back and forth between basic and advanced filtering by clicking the Advanced Filter Options link to show/hide the advanced options as needed. When switching from basic to advanced, any basic filters you have entered will automatically carry over; however, the opposite is not true. When switching from advanced back to basic, the basic options will be blank.
TIP: Keep in mind that you can switch back and forth between basic and advanced filtering by clicking the Advanced Filter Options link to show/hide the advanced options as needed. When switching from basic to advanced, any basic filters you have entered will automatically carry over; however, the opposite is not true. When switching from advanced back to basic, the basic options will be blank.
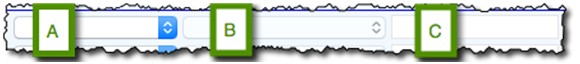
A) Click the left-hand drop-down arrow and select the data variable with which the report contents are to be filtered.
![]() NOTE: The drop-down lists in this column are populated with the report variables selected on the previous Report Options page.
NOTE: The drop-down lists in this column are populated with the report variables selected on the previous Report Options page.
B) Click the middle drop-down arrow and select the type of filter to be used:
|
Equals |
Not Equal to |
Greater than |
|
Greater than or Equal to |
Less than |
Less than or Equal to |
|
Contains |
Does not Contain |
Is Blank |
|
Is not Blank |
Between |
|
C) In the right-hand field type the filter criteria.
![]() TIP: For example if, in a services ReportBuilder, "Service Type" was selected as one of the variables to be included in the report, and the report contents should contain only those services where the type is "Counseling," the filter options would be set as shown here.
TIP: For example if, in a services ReportBuilder, "Service Type" was selected as one of the variables to be included in the report, and the report contents should contain only those services where the type is "Counseling," the filter options would be set as shown here.
![]()
![]() TIP: In most instances AWARDS completes logic checks to ensure that the filter criteria entered are logical; however, those checks are not performed when "Between" is selected as the filter type. Additionally, keep in mind that report filters are not case sensitive when entering text; however, when entering dates you should always use the format mm/dd/yyyy.
TIP: In most instances AWARDS completes logic checks to ensure that the filter criteria entered are logical; however, those checks are not performed when "Between" is selected as the filter type. Additionally, keep in mind that report filters are not case sensitive when entering text; however, when entering dates you should always use the format mm/dd/yyyy.
![]() TIP: When additional filter sets are added, each will have a border around it. An additional "and / or" option is included between each set.
TIP: When additional filter sets are added, each will have a border around it. An additional "and / or" option is included between each set.
The process of setting the ReportBuilder filter options is now complete.
![]() IMPORTANT TIP - Using Dynamic Date Filters on ReportBuilders!
IMPORTANT TIP - Using Dynamic Date Filters on ReportBuilders!
One of the most common uses for filters is to place limits on date fields; for example, if you want a report that shows you notes written since January 1st, you can add a filter that days "Contact Date is Greater Than or Equal to 1/1/2018." But what if you want that date to change? For instance, you may want a report to show you all of the notes that were written in the last two weeks, regardless of when you choose to run that report; that's where dynamic date filters come in!
AWARDS allows you to add filter options on date fields that include keywords such as "days," "weeks," "months," and "years," as well as qualifiers such as "next" and "last." AWARDS will also recognize days of the week and months of the year. You can place a number in front of any of those keywords and use plus or minus signs to specify whether you want the filter to go in the future or in the past that many units.
Here are some examples of filters you can use that take advantage of these dynamic options:
- Admission Date is Greater Than or Equal to "-2 Weeks" (will show all clients admitted in the past two weeks)
- Date Modified is Between "-30 Days" and "-7 Days" (will show notes modified more than 7 days ago, but less than 30 days ago)
- Contact Date equals "Last Tuesday" (will show you notes with a date equal to the previous Tuesday)
Return to the top of the page.
The ReportBuilder header option is located beneath the filters portion of the Report Options - Continued page.
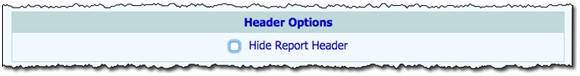
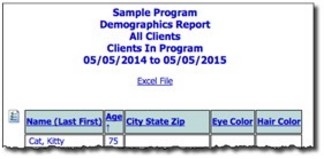
This option enables users to adjust what is displayed at the top of the report. By default, the name of the program or program group for which the report was run, along with key report parameters (such as date range), are displayed at the top of the report page; for example:
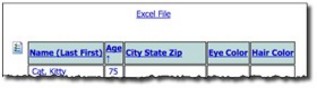
To hide these details from the report display, click the Hide Report Header checkbox. When checked, all report header information is hidden from view, leaving only the Excel File link at the top of the page as shown here:
Return to the top of the page.
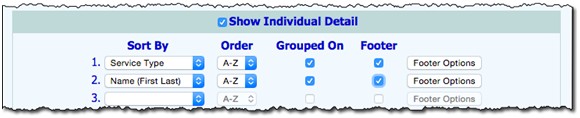
The ReportBuilder individual detail options are located in the middle of the Report Options - Continued page.
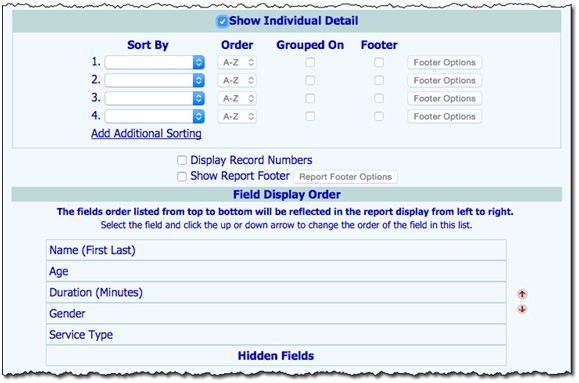
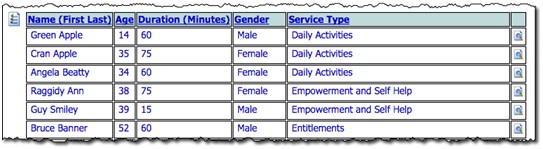
These options enable users to adjust the way in which report contents are displayed. Specifically, when the report content is displayed with individual detail, the report includes a column for each data variable and a row for each client record (after filters are applied, if applicable). The total record count is also displayed beneath the report table.
Once you choose to include individual detail in the report, you can apply sort options to control the order in which the rows of data are displayed, and field options to control the order in which the columns of data are displayed. You can also group the data by variable, and add sum and total information when appropriate.
![]() TIP: The individual detail report options can be used alone, or in combination with the summary table report options described under Summary Table Options. If the individual detail report options are not used, summary table selections must be made before the report can be generated.
TIP: The individual detail report options can be used alone, or in combination with the summary table report options described under Summary Table Options. If the individual detail report options are not used, summary table selections must be made before the report can be generated.
To use the ReportBuilder individual detail options, complete the following steps:
![]() TIP: The other individual detail related options mentioned in the steps below are not available on the Report Options - Continued page until step 1 has been completed.
TIP: The other individual detail related options mentioned in the steps below are not available on the Report Options - Continued page until step 1 has been completed.
![]() NOTE: The sort by drop-down lists are populated with the variables selected on the previous Report Options page.
NOTE: The sort by drop-down lists are populated with the variables selected on the previous Report Options page.
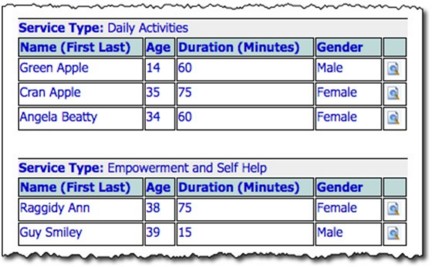
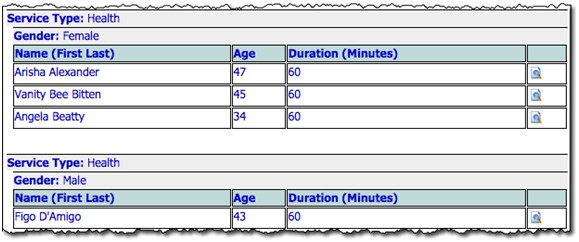
Keep in mind that if multiple groupings are specified for the report, each is displayed as its own header, indented by sort order. Remaining fields not grouped on are displayed in the table underneath each set of grouped on headers. For example, in the same sample report shown above, if contents were also grouped on "Gender," you'd see a separate table for each service type and gender combination as shown here in this example for the Health service type:
![]() TIP: When grouping is used, sorting on the report page is unavailable. Be sure to set any sorting on the Report Options - Continued settings page as needed.
TIP: When grouping is used, sorting on the report page is unavailable. Be sure to set any sorting on the Report Options - Continued settings page as needed.
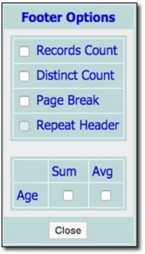
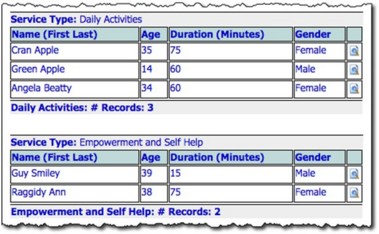
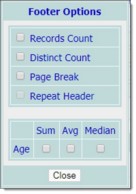
![]() Records Count - When checked, a count of records is displayed as a footer beneath each grouped value. For example, when the "Records Count" option is selected when grouped by "Service Type," the following is an example of how record count data will display on the report:
Records Count - When checked, a count of records is displayed as a footer beneath each grouped value. For example, when the "Records Count" option is selected when grouped by "Service Type," the following is an example of how record count data will display on the report:
![]() Distinct Count - When checked, a count of distinct values (the count of values that appear) for the grouped on field will display.
Distinct Count - When checked, a count of distinct values (the count of values that appear) for the grouped on field will display.
![]() Page Break - When checked, each grouped on portion of the report will display on a separate page when printed. This option is especially useful for those instances where you would like to print a separate report for various groups of data without having to create a different report for each. For example, if a report is run for "All Agency Programs" and one of the data variables is "Program," sorting by and grouping on that variable with the page break option selected would result in the report data for each program being printed on a separate page.
Page Break - When checked, each grouped on portion of the report will display on a separate page when printed. This option is especially useful for those instances where you would like to print a separate report for various groups of data without having to create a different report for each. For example, if a report is run for "All Agency Programs" and one of the data variables is "Program," sorting by and grouping on that variable with the page break option selected would result in the report data for each program being printed on a separate page.
![]() TIP: This option is only set once per report. As a result, it is only available when viewing the Footer Options for the first Sort By variable. For example, in the following instance only the Footer Options for "Service Type" will include the Page Break checkbox even though there are multiple Sort By rows set.
TIP: This option is only set once per report. As a result, it is only available when viewing the Footer Options for the first Sort By variable. For example, in the following instance only the Footer Options for "Service Type" will include the Page Break checkbox even though there are multiple Sort By rows set.
![]() Report Header - When checked, the report header information is displayed at the top of each printed page after each grouped on page break. These headers will not display on the page in AWARDS, only on the printed report.
Report Header - When checked, the report header information is displayed at the top of each printed page after each grouped on page break. These headers will not display on the page in AWARDS, only on the printed report.
![]() TIP: This option is only selectable when the "Page Break" footer option has been checked off, AND the header option "Hide Report Header" is NOT checked off.
TIP: This option is only selectable when the "Page Break" footer option has been checked off, AND the header option "Hide Report Header" is NOT checked off.
![]() Sum / Avg / Median - Available for numeric or currency values only. When "Sum" is checked a sum of grouped values is included. When "Avg" is checked, an average is included of the sum divided by the count for the corresponding number of groups under the chosen grouping variable. When "Median" is checked, the middle of the sorted list of numbers is included.
Sum / Avg / Median - Available for numeric or currency values only. When "Sum" is checked a sum of grouped values is included. When "Avg" is checked, an average is included of the sum divided by the count for the corresponding number of groups under the chosen grouping variable. When "Median" is checked, the middle of the sorted list of numbers is included.
Sum/Avg/Median and count options can be used individually or in combination. When all necessary selections have been made, click Close.
![]() TIP: Selecting the "Footer" option WITHOUT specifying related count and/or sum/avg/median selections results in a blank row beneath each group in the report. This can be used to help visually separate each of the grouped on values.
TIP: Selecting the "Footer" option WITHOUT specifying related count and/or sum/avg/median selections results in a blank row beneath each group in the report. This can be used to help visually separate each of the grouped on values.
![]() TIP: If fewer than four data variables were chosen on the Report Options page, the number of available sort by options equals the number of selected variables.
TIP: If fewer than four data variables were chosen on the Report Options page, the number of available sort by options equals the number of selected variables.
When all necessary selections have been made, click Close.
![]() NOTE: This option is only available if the Display Record Numbers option was NOT checked in step 8; the two settings are incompatible.
NOTE: This option is only available if the Display Record Numbers option was NOT checked in step 8; the two settings are incompatible.
![]() TIP: If more than eight variables were chosen on the Report Options page, the "Field Display Order" portion of the page is not automatically populated with those variables. To view the variables list so that the order of the columns can be adjusted, click Show Ordered Field List before completing this step.
TIP: If more than eight variables were chosen on the Report Options page, the "Field Display Order" portion of the page is not automatically populated with those variables. To view the variables list so that the order of the columns can be adjusted, click Show Ordered Field List before completing this step.
![]() IMPORTANT! Please keep in mind that if the "Grouped On" option has been used for one or more of the "Sort By" variables, those variables are automatically displayed as the first columns in the table, regardless of what is specified here.
IMPORTANT! Please keep in mind that if the "Grouped On" option has been used for one or more of the "Sort By" variables, those variables are automatically displayed as the first columns in the table, regardless of what is specified here.
![]() TIP: The field display order listed from top to bottom here is reflected in the report data columns display from left to right.
TIP: The field display order listed from top to bottom here is reflected in the report data columns display from left to right.
To hide a field from the report contents entirely, move it beneath the available "Hidden Fields" row. By doing so you can still filter your report contents on that variable, but keep its individual detail from being a part of the report if it is not necessary to include it.
![]() IMPORTANT! Any fields for which the Grouped On or Footer options were set in steps 4 or 5 are always included in the report content even if it is specified here that they should be "hidden;" otherwise, the report content will not display properly.
IMPORTANT! Any fields for which the Grouped On or Footer options were set in steps 4 or 5 are always included in the report content even if it is specified here that they should be "hidden;" otherwise, the report content will not display properly.
The process of setting the individual detail report options is now complete.
Return to the top of the page.
The ReportBuilder summary table options are located at the bottom of the Report Options - Continued page.
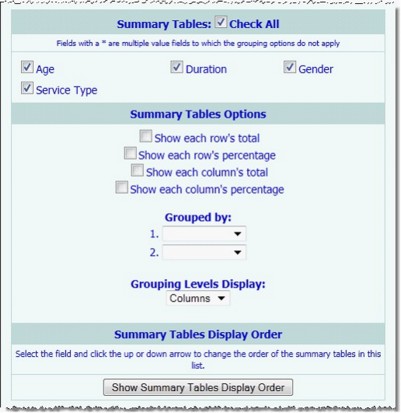
These options enable users to include aggregate counts of selected report variables. They also allow for customization of how those counts are displayed, and the types of information they contain.
![]() TIP: The summary table report options can be used alone, or in combination with the individual detail report options described under Individual Detail Options. If the summary table report options are not used, individual detail selections must be made before the report can be generated.
TIP: The summary table report options can be used alone, or in combination with the individual detail report options described under Individual Detail Options. If the summary table report options are not used, individual detail selections must be made before the report can be generated.
To use the ReportBuilder summary table options, complete the following steps:
![]() NOTE: The summary tables checkboxes list is composed of the data variables selected on the previous Report Options page.
NOTE: The summary tables checkboxes list is composed of the data variables selected on the previous Report Options page.
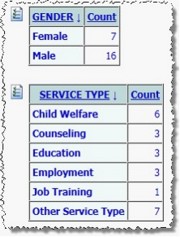
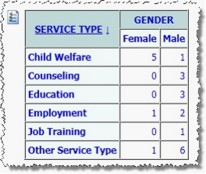
For example, when using a services ReportBuilder, if "Gender" and "Service Type" are selected as summary table options and the report is generated, the report contents will include a separate summary table for each, with aggregate counts of each variable as shown here.
![]() TIP: These "total" checkboxes and the other summary table-related options mentioned in the steps that follow are not available on the Report Options - Continued page until one or more summary tables are chosen in step 1.
TIP: These "total" checkboxes and the other summary table-related options mentioned in the steps that follow are not available on the Report Options - Continued page until one or more summary tables are chosen in step 1.
For example, if a report is generated with the "Service Type" summary table option checked and with "Gender" as the Grouped By selection, the report contents will appear as shown here.
![]() TIP: The grouping options described here in steps 4, 5, 6, and 7 are only applicable when more than one summary table is available for inclusion in the report.
TIP: The grouping options described here in steps 4, 5, 6, and 7 are only applicable when more than one summary table is available for inclusion in the report.
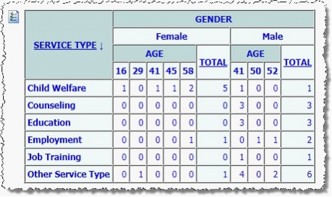
For example, if a report is generated with the "Service Type" summary table option checked, "Gender" as the primary grouping, and "Age" as the secondary grouping, the report contents will appear as shown here.
![]() TIP: Please keep in mind the following with regard to using this option:
TIP: Please keep in mind the following with regard to using this option:
- It is recommended that this option NOT be checked off if you plan on exporting the report data to Excel for further calculations, as the percentage breakdown is not split out into a separate field.
- When this option IS checked off, the Grouping Levels Display option, detailed in step 7, must be set to use "Columns."
- Examples of how this feature can be beneficial are available here.
![]() Columns - When this option is selected, the summary table fields are rows in the summary tables, while any grouped by selections are displayed as columns across the top of the tables. (This option must be selected if the Show each value's percentage option was checked off in step 6.)
Columns - When this option is selected, the summary table fields are rows in the summary tables, while any grouped by selections are displayed as columns across the top of the tables. (This option must be selected if the Show each value's percentage option was checked off in step 6.)
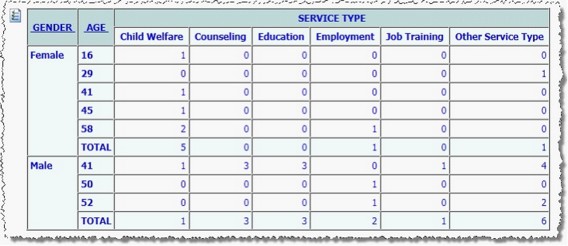
![]() Rows - When this option is selected, the summary table fields are displayed as column in the summary tables, while any grouped by selections are displayed as rows in the tables. For example, if the sample report shown in step 5 is set to use "Rows" instead of "Columns," the report contents will appear as shown here.
Rows - When this option is selected, the summary table fields are displayed as column in the summary tables, while any grouped by selections are displayed as rows in the tables. For example, if the sample report shown in step 5 is set to use "Rows" instead of "Columns," the report contents will appear as shown here.
The default value is "Columns."
![]() TIP: This option is only applicable when one or more "Grouped By" selections have been made.
TIP: This option is only applicable when one or more "Grouped By" selections have been made.
![]() TIP: This option is only applicable when more than one summary table is available for inclusion in the report.
TIP: This option is only applicable when more than one summary table is available for inclusion in the report.
The process of setting the summary table report options is now complete.
Return to the top of the page.
https://demodb.footholdtechnology.com/help/?11721