|   |
| |
To create and save a ReportBuilder report that can be re-run in the future, or to generate a single-use report, complete the following steps:
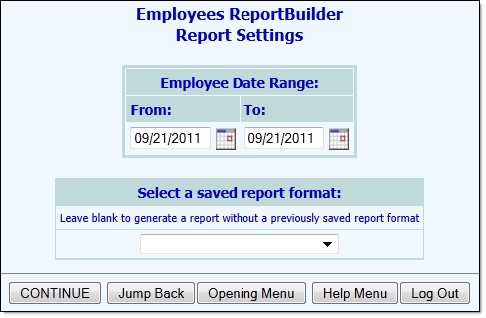
This page contains date range selections, as well as a list of any saved report formats to which you have access.
In this context payroll records are "Payroll Group Status History Records" as entered using the Human Resource module's Staff Information or Payroll Status features. An active payroll record means that the start or end date of the employee's payroll group status history overlaps with the report period at some point.
To view an existing report for which a format was previously saved see Viewing/Updating an Existing ReportBuilder Report.
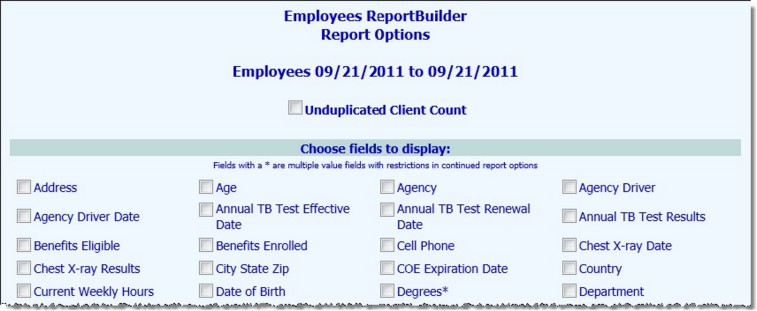
This page contains an alphabetical list of client employee characteristic check boxes representing data collected in several AWARDS locations:
|
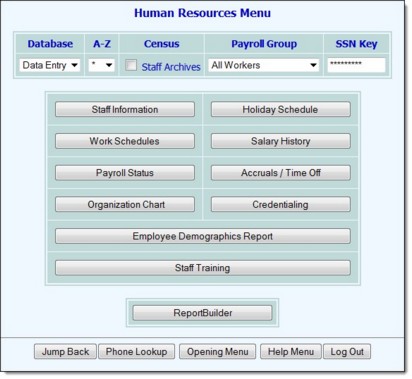
Staff Information |
Credentialing |
Payroll Status |
Work Schedules |
Several other characteristics which are not necessarily found on the above forms are also available; for example, "age," "seniority start date," "termination date," and "seniority."
Employee characteristic fields with an asterisk (*) next to them are those for which one employee may have multiple values. Multiple value fields include those that have check boxes for data entry where multiple boxes may be checked for each client, as well as instances where multiple records may have been entered for a client, such as worksite detail in work schedules.
Individual detail report options and/or summary table selections must be set before the report can be generated. For more information on using the various demographics report options click here.
If it is not necessary to save the report format and you wish only to view the report contents, please skip to step 14.
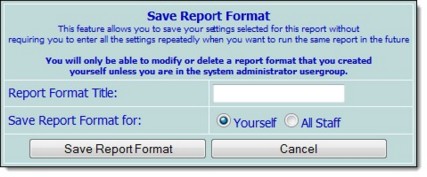
We recommend that the title used be indicative of the report contents so that it is easily identifiable when selecting the format for the purposes of running the report in the future.
→ Yourself - When this option is selected, only the user saving the report format has the ability to use or modify that format.
→ All Staff - When this option is selected, all staff have the ability to view the report; however, only you and other individuals with the ability to save reports for all staff will be able to modify or delete that format.
In a single-agency AWARDS database, only members of the "System Administrator" and "Executive Officer" user groups have the ability to save report formats to be used by others. In a multi-agency/HMIS AWARDS database, the option to save reports for other users is available to the "System Administrator," "CoC Executive Officer," "CoC Executive Support Staff," and "Agency Executive Officer" user groups. People who are not members of the specified user groups can only save report formats for themselves.
When working with the report data, please keep in mind that:
→ The report shows the values for each characteristic as of the date on which the report is generated. For example, if an employee's marital status on his or her date of hire was "Married," but it has since changed to "Divorced," the report shows him or her as divorced, even when the report is run with the date range set to include the employee's hire date.
→ When the report includes multiple value characteristics (those with an asterisk next to them on the initial Report Options page), the individual detail for each employee includes a list of the characteristic values separated by commas. Additionally, because each employee may have more than one value, the summary table totals information for any multiple value characteristic may not add up to the total number of employees.
→ When a report is long enough to require you to scroll down the page to view all of its content, the header row of the data table (individual detail and/or summary) "freezes" at the top of the page, while the rest of the report detail is viewed. This enables you to view the column labels, even when scrolling down the page. Similarly, when printing a report that covers more than one page, the header row of any tables split between pages is shown at the top of each page.
→ Show/hide individual detail or summary table content - In some cases you may have chosen to include an employee characteristic in the report for filtering or grouping purposes, but do not necessarily want to see the associated individual detail. Likewise, you may choose to include percentages or totals for summary tables but not want that information shown for all of those tables. In such instances, you can adjust which table columns are displayed on the report page, as well as whether individual detail is shown or hidden. To do so, click the show/hide icon to the left of the table you would like to alter.
![]()
The Column/Row Display pop-up for that table is displayed, an example of which is shown here:
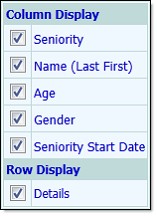
Check or uncheck columns for that table as needed, and/or uncheck the row display "Details" option to hide individual detail completely (leaving "grouped on" data/cells and subtotal footer rows, if applicable). Checked columns/rows are displayed, unchecked are hidden.
The option to hide individual detail rows is only available when grouped on/footer options have been selected under "Individual Detail" on the Report Options - Continued page.
Showing/hiding columns and/or rows of individual detail or summary tables does not impact the contents of the Excel File version of the report data.
→ Sort individual detail or summary table contents - Click the heading of any table column to sort the table contents by that characteristic. Click that heading again to reverse the sort order. To sort by a secondary characteristic, press <SHIFT> and click on the second column heading.
When "Grouped On" has been selected as an individual detail option under report settings, sorting is NOT available.
When sorting is used, an ↑ or ↓ arrow next to a column heading indicates that the table data is being sorted using that column. The direction of the arrow indicates whether the sorting is in ascending (↑) or descending (↓) order. In this example, the table is being sorted alphabetically by client name from A to Z.
![]()
Changing the sort order of an individual detail or summary table overrides any sorting for those tables specified in the report settings or in a saved report format. However, such changes do not impact the contents of the Excel File version of report data, nor are they saved when a report format is saved.
→ Print the report - To do so, click File on the Internet browser's menu bar and select Print. Adjust the printer settings as necessary, and then click Print to complete the printing process.
→ Export the contents to Microsoft Excel - To do so, click the Excel File link at the top of the page.
→ Save the format of the report for future use if you have not already done so - To do so, click the Internet browser's Back button to return to the Report Options - Continued page, and then complete steps 10 through 14 above.
The process of generating a new demographics report is now complete.