|   |
| |
When generating an employee report, several types of options are available for the purposes of customizing the report's contents and the way in which those contents are displayed. These options, which are all found on the Report Options - Continued page, are categorized as:
To view detailed information on these ReportBuilder report options, click the option category above or scroll through the content below.
The ReporBuilder filter options are located at the top of the Report Options - Continued page.
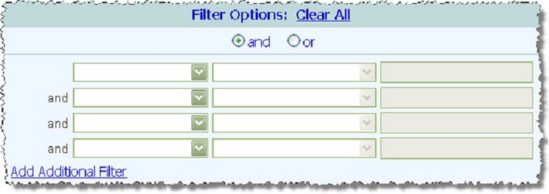
These filters enable users to adjust the scope of report contents by applying user-specified criteria to the employee characteristics chosen on the initial Report Options page.
Filters are applied to the report contents regardless of whether those contents are displayed using the individual detail report options, summary tables, or both. For more information on individual detail and summary tables, please see the corresponding sections that follow.
To use the ReportBuilder report filters, complete the following steps:
The drop-down lists in this column are populated with the employee characteristics selected on the previous Report Options page.
|
Equals |
Not Equal to |
Greater than |
Greater than or Equal to |
|
Less than |
Less than or Equal to |
Contains |
Does not Contain |
|
Is Blank |
Is not Blank |
Between |
|
![]()
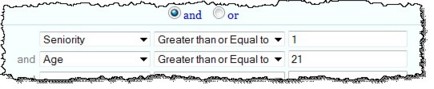
In most instances AWARDS completes logic checks to ensure that the filter criteria entered are logical; however, those checks are not performed when "Between" is selected as the filter type.
Report filters are not case sensitive when entering text; however, when entering dates you should always use the format mm/dd/yyyy.
It is not possible to combine "and" and "or" filters. As a result, the filter combination selection made in this step applies to all of the filter options set for the report.
The process of setting the ReportBuilder filter options is now complete.
The ReportBuilder individual detail options are located in the middle of the Report Options - Continued page.
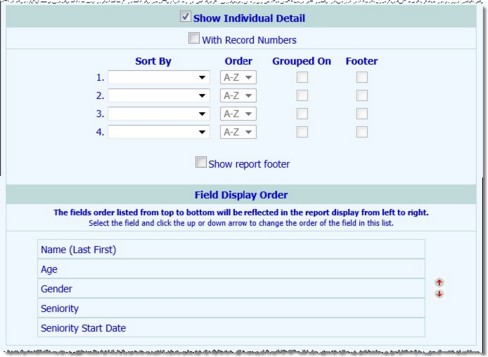
These options enable users to adjust the way in which report contents are displayed. Specifically, when the report content is displayed with individual detail, the report includes a column for each characteristic data field and a row for each employee record (after filters are applied, if applicable). The total employee count is also displayed beneath the report table.
Once you choose to include individual detail in the report, you can apply sort options to control the order in which the rows of data are displayed, and field options to control the order in which the columns of data are displayed.
The individual detail report options can be used alone, or in combination with the summary table report options described under Summary Table Options. If the individual detail report options are not used, summary table selections must be made before the report can be generated.
To use the ReportBuilder individual detail options, complete the following steps:
This check box and the other individual detail table-related options mentioned in the steps that follow are not available on the Report Options - Continued page until step 1 has been completed.
The sort by drop-down lists are populated with the employee characteristics selected on the previous Report Options page.
When this option is used, sorting the report with the column headers of the actual data tables is unavailable.
→ Count - When checked, a count of records is displayed as a footer beneath each grouped value.
→ Sum - Available for numeric or currency variables only. When checked, a sum of grouped values is included.
Sum and count options can be used individually or in combination. When all necessary selections have been made, click Close.
Selecting the "Footer" option WITHOUT specifying related count and/or sum selections results in a blank row beneath each group in the report. This can be used to help visually separate each of the grouped on values.
If fewer than four employee characteristics were chosen on the Report Options page, the number of available sort by options equals the number of selected characteristics.
When all necessary selections have been made, click Close.
If more than eight employee characteristics were chosen on the Report Options page, the "Field Display Order" portion of the page is not automatically populated with the employee characteristics. To view the characteristics list so that the order of the columns can be adjusted, click Show Ordered Field List before completing this step.
Please keep in mind that if the "Grouped On" option has been used for one or more of the "Sort By" variables, those variables are automatically displayed as the first columns in the table, regardless of what is specified here.
The field display order listed from top to bottom here is reflected in the report data columns display from left to right.
The process of setting the individual detail report options is now complete.
The ReportBuilder summary table options are located at the bottom of the Report Options - Continued page.
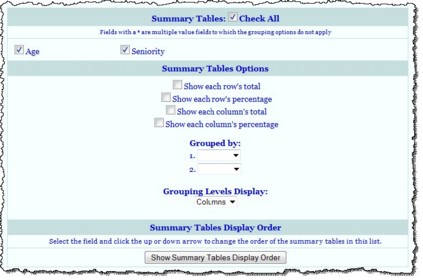
These options enable users to include aggregate counts of selected employee characteristics. They also allow for customization of how those counts are displayed, and the types of information included.
The summary table report options can be used alone, or in combination with the individual detail report options described under Individual Detail Options. If the summary table report options are not used, individual detail selections must be made before the report can be generated.
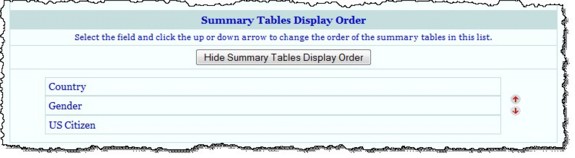
To use the ReportBuilder summary table options, complete the following steps:
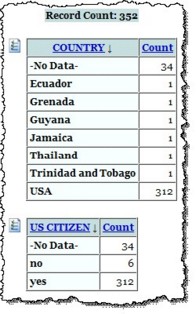
For example, if "US Citizen" and "Country" are selected as summary table options and the report is generated, the report contents will include a separate summary table for each, with aggregate counts of each characteristic as shown here.
The summary tables check boxes list is composed of the employee characteristics selected on the previous Report Options page; however, several characteristic data fields are not available for selection as part of a summary table, regardless of whether they were selected on the previous page. These characteristics - such as name, date of birth, social security number, employee ID, street address, phone number, and so on - are excluded because they have values that are unique to each employee, and are unlikely to generate any meaningful summary data.
These "total" check boxes and the other summary table-related options mentioned in the steps that follow are not available on the Report Options - Continued page until one or more summary tables are chosen in step 1.
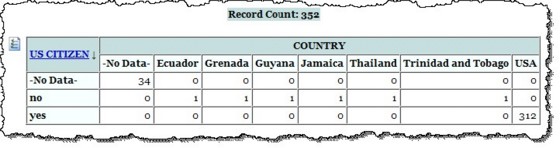
For example, if a report is generated with the "US citizen" summary table option checked and with "Country" as the Grouped By selection, the report contents will appear as shown here.
Multiple value fields (noted with an asterisk) cannot be selected as the characteristic used for grouping.
The grouping options described here in steps 4, 5, and 6 are only applicable when more than one summary table is available for inclusion in the report.
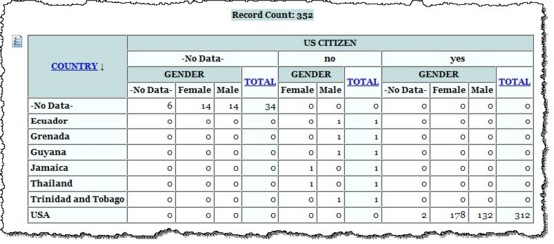
For example, if a report is generated with the "Country" summary table option checked, "US Citizen" as the primary grouping, and "Gender" as the secondary grouping, the report contents will appear as shown here.
→ Columns - When this option is selected, the summary table fields are rows in the summary tables, while any grouped by selections are displayed as columns across the top of the tables.
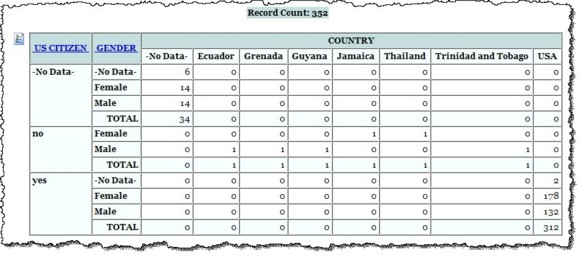
→ Rows - When this option is selected, the summary table fields are displayed as columns in the summary tables, while any grouped by selections are displayed as rows in the tables. For example, if the sample report shown in step 5 is set to use "Rows" instead of "Columns," the report contents will appear as shown here.
The default value is "Columns."
This option is only applicable when one or more "Grouped By" selections have been made.
This option is only applicable when more than one summary table is available for inclusion in the report.
The process of setting the summary table report options is now complete.