|
|   |
To access and use the Dashboard feature, complete the following steps from the AWARDS Home screen:
![]() NOTE: Within the Dashboard, like graphs are grouped using tabs. By default the first of the tabs, "Status Changes," is open on the Dashboard page.
NOTE: Within the Dashboard, like graphs are grouped using tabs. By default the first of the tabs, "Status Changes," is open on the Dashboard page.
![]() TIP: For more information on each of the tabs and the data sets/graphs they contain, please see the Dashboard Graph Details.
TIP: For more information on each of the tabs and the data sets/graphs they contain, please see the Dashboard Graph Details.
When a new tab is clicked, the page is refreshed to display the selection options for that tab. Beneath the tab settings a default graph is displayed. This graph is for the first program in your "[tab name] for" selection list, and it includes data for the first selection in the "Data Set" drop-down list, configured in steps 4 and 5, respectively.
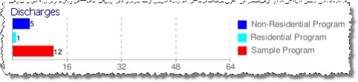
If a group of programs is selected, data for the programs is combined rather displayed in individual graphs. Each program in a multi-program graph can be clearly identified using a provided color key, an example of which is shown here:
![]() NOTE: In the event that the selected group of programs contains more than 20 programs, the data is divided into multiple graphs, with up to 20 programs in each. In such cases the table values (if displayed based on your selection in step 6 below) are grouped in a single table at the bottom of the page.
NOTE: In the event that the selected group of programs contains more than 20 programs, the data is divided into multiple graphs, with up to 20 programs in each. In such cases the table values (if displayed based on your selection in step 6 below) are grouped in a single table at the bottom of the page.
![]() NOTE: If the selected group has more than 40 programs the page will take longer to load. As a result, the graphs are not immediately shown when the page is refreshed. Instead, a notification message is displayed informing you of the potential delay. Click Continue if you would like to proceed anyway, or select a smaller group from the [tab name] for drop-down list.
NOTE: If the selected group has more than 40 programs the page will take longer to load. As a result, the graphs are not immediately shown when the page is refreshed. Instead, a notification message is displayed informing you of the potential delay. Click Continue if you would like to proceed anyway, or select a smaller group from the [tab name] for drop-down list.
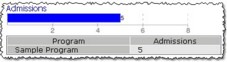
![]() NOTE: "Graph Only" - the default selection - displays data in the form of bar or line graphs (based on the tab selected); for example:
NOTE: "Graph Only" - the default selection - displays data in the form of bar or line graphs (based on the tab selected); for example:
![]()
The "With Table Values" selection adds a table of values beneath each graph as shown here:
The process of using the Dashboard is now complete.
https://demodb.footholdtechnology.com/help/?10180